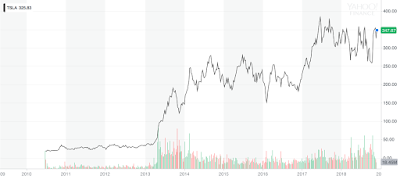
Source: finance.yahoo.com
November 28, 2018
S&P, Dow Jones and Nasdaq over years
Click to zoom. Created using finance.yahoo.com
GSPC - S&P
DJI - Dow Jones
IXIC - Nasdaq
Before 1980s
1980s to 2000s
2000s onwards
End
GSPC - S&P
DJI - Dow Jones
IXIC - Nasdaq
Before 1980s
1980s to 2000s
2000s onwards
End
Java program to print Fibonacci sequence
import java.text.DecimalFormat;
public class Fib {
public static void main(String args[]) {
for (int i = 1; i <= 20; i++) {
System.out.println("[" + i + "] : " + fib(i) + " : " + new DecimalFormat("#.###").format(ratio(i)));
}
}
private static int fib(int n) {
if (n==1 || n==2) {
return 1;
} else {
return fib(n-1) + fib(n-2);
}
}
private static double ratio(int n) {
if (n > 1) {
return (double)fib(n-1)/(double)fib(n);
} else {
return 0;
}
}
}
0.618 ratio in Fibonacci sequence
Index: Num: Ratio
[1] : 1 : 0
[2] : 1 : 1
[3] : 2 : 0.5
[4] : 3 : 0.667
[5] : 5 : 0.6
[6] : 8 : 0.625
[7] : 13 : 0.615
[8] : 21 : 0.619
[9] : 34 : 0.618
[10] : 55 : 0.618
[11] : 89 : 0.618
[12] : 144 : 0.618
[13] : 233 : 0.618
[14] : 377 : 0.618
[15] : 610 : 0.618
[16] : 987 : 0.618
[17] : 1597 : 0.618
[18] : 2584 : 0.618
[19] : 4181 : 0.618
[20] : 6765 : 0.618
November 21, 2018
R Save a plot file
# save
jpeg('some.jpg')
ggplot(
data = somedata,
aes(x = mth, y = x)
)
# save
dev.off()
jpeg('some.jpg')
ggplot(
data = somedata,
aes(x = mth, y = x)
)
# save
dev.off()
R US map plot
if (!require(zipcode)) install.packages('zipcode')
library(zipcode)
if (!require(plyr)) install.packages('plyr')
library(plyr)
if (!require(maps)) install.packages('maps')
library(maps)
if (!require(ggplot2)) install.packages('ggplot2')
library(ggplot2)
# file containing zip codes and population in each
locs <- read.csv("~/R_work/loc.csv", header=TRUE, sep=",")
data(zipcode)
loc$zip <- clean.zipcodes(locs$zip) # clean zipcodes
locs <- merge(locs, zipcode, by.x = 'zip', by.y ='zip') # merge 2 data frames
# mainland locs
locs_us <- locs[locs$state %in% c('AL','AZ','AR','CA','CO','CT','DE','FL','GA', 'ID','IL','IN','IA','KS','KY','LA','ME','MD','MA','MI','MN','MS','MO','MT','NE','NV','NH','NJ','NM','NY','NC','ND','OH','OK','OR','PA','RI','SC','SD','TN','TX','UT','VT','VA','WA','WV','WI','WY'), ]
install.packages("maps")
install.packages("ggplot2")
library(maps)
library(ggplot2)
all_states <- map_data("state")
p <- ggplot()
p <- p + geom_polygon(data = all_states,
aes(x=long, y=lat, group=group),
color="white")
p <- p +
geom_point(data = locs_us,
aes(x=longitude, y=latitude, size=population_count),
color="red") +
scale_size(name = "Title")
p
R Boxplot excluding outliers
if (!require(ggplot2)) install.packages('ggplot2')
library(ggplot2)
...
ggplot(somedata, aes(x = col1, y = col2)) +
xlab("Time") +
ylab("Amount") +
geom_boxplot(outlier.shape = NA) # exclude outliers
library(ggplot2)
...
ggplot(somedata, aes(x = col1, y = col2)) +
xlab("Time") +
ylab("Amount") +
geom_boxplot(outlier.shape = NA) # exclude outliers
R Barchart
if (!require(ggplot2)) install.packages('ggplot2')
library(ggplot2)
...
ggplot(
data=somedata,
aes(x=mth_end_dt, y=col3/1000000, colour=col2)
) +
geom_bar (stat="identity", width = 10.0, position = position_dodge(width = 10.0)) +
xlab("Month") +
ylab("Trend") +
scale_x_date(
date_breaks = "1 month"
)
library(ggplot2)
...
ggplot(
data=somedata,
aes(x=mth_end_dt, y=col3/1000000, colour=col2)
) +
geom_bar (stat="identity", width = 10.0, position = position_dodge(width = 10.0)) +
xlab("Month") +
ylab("Trend") +
scale_x_date(
date_breaks = "1 month"
)
R IN operator
somedata[somedata$col1 %in% c('A', 'B'),]
R melt data frame - convert to long format
melted_data <- melt(somedata[somedata$col1 %in% c('A', 'B'),], id="col1") # convert to long format
Before
C z 3
After melt
| col1 | col2 | col3 |
| A | x | 1 |
| B | y | 2 |
After melt
| col1 | variable | value |
| A | col2 | x |
| A | col3 | 1 |
| B | col2 | y |
| B | col3 | 2 |
R - Subset of data in a data frame
asubset = somedata[somedata$mth_end_dt >="2016-01-01" & somedata$mth_end_dt <= "2016-12-31",]
Note: [row filter,column filter]
[row filter, ] means all rows matching the filter. all columns without filtering
y = asubset [, c('col5', 'col6')] means all rows but only include 2 columns namely col5 and col6
Note: [row filter,column filter]
[row filter, ] means all rows matching the filter. all columns without filtering
y = asubset [, c('col5', 'col6')] means all rows but only include 2 columns namely col5 and col6
R Multiple line/Multi trend plot
if (!require(ggplot2)) install.packages('ggplot2')
library(ggplot2
...
ggplot(
data = somdata,
aes(x = mth_end_dt, y = hour, colour = dept)
) +
xlab("Month") +
ylab("Hour") +
geom_line() +
geom_point() +
geom_text(aes(label=hour), vjust=-0.5, size=3) +
scale_x_date(
date_breaks = "1 month",
# date_labels="%b-%Y"
) +
scale_colour_discrete(name ="Department")
R Line plot
if (!require(ggplot2)) install.packages('ggplot2')
library(ggplot2)
....
ggplot(
data = somedata,
aes(x = mth, y = hours)
) +
xlab("Month") +
ylab("Hours") +
geom_line() +
geom_point() +
scale_x_date(
date_breaks = "1 month",
# date_labels="%b-%Y"
)
library(ggplot2)
....
ggplot(
data = somedata,
aes(x = mth, y = hours)
) +
xlab("Month") +
ylab("Hours") +
geom_line() +
geom_point() +
scale_x_date(
date_breaks = "1 month",
# date_labels="%b-%Y"
)
R - Group by aggregation
x_aggr <- aggregate(x$a, by=list(mth=x$mth_end_dt), FUN=sum)
R - Convert field to Date
> a$mth_end_dt <- as.Date(a$mth_end_dt, "%m/%d/%Y")
R read csv file
comp_fte_trnd <- read.csv("~/R_work/afile.csv", header=TRUE, sep="|")
Subscribe to:
Comments (Atom)


