Showing posts with label Technical Analysis. Show all posts

December 10, 2018

Doji Candlestick pattern

Noticed the formation of Doji candlestick patterns on Dec 12th for APPL (source of chart: finance.yahoo.com)

Doji represents a state of uncertainty where neither bulls or bears win.


In Technical Analysis, a candlestick captures the movement of the market for the timeframe/session specified. The session could be a minute, hour, day, week, month...

The top of the candle body represents the open price, the bottom closing price, the end of the upper wick the highest price within the session, and the end of lower wick the lowest price within the session.


Color coding the candle makes it easy to analyze whether the market was bullish or bearish. Typically red indicate a bear, and green a bull. See the price movement of Apple on July 24 and July 31st.


--


Dojis are formed when Open and Close price are the same. There are 3 types of Dojis to lookout for:

Long legged Doji: Forms when big upward and downward movements within a session, but neither bull or bear wins. Its a fight. When the overall market trend is moving up or down, the formation of a long legged Doji may be indicative of a trend reversal.


Dragonfly Doji: Show that even though bears have pushed the price down, it returned to the open state. It is a reliable indicator that the trend is reversing.


Gravestome Doji: This is an indicator that the bullish market is nearing an end.


..


December 7, 2018

% Difference of Close from the highest Close for S&P 500

The highlighted is the  highest Close which happened in September 2018. Source: finance.yahoo.com

DateOpenHighLowCloseVolume% Difference from highest CloseData is
11/1/17         2,583.20996              2,657.73999               2,557.44995           2,584.84009 95 Billion                              11.2952 Monthly
12/1/17         2,645.10010              2,694.96997               2,605.52002           2,673.61011 65 Billion                                 8.2489 Monthly
1/1/18         2,683.72998              2,872.87012               2,682.36011           2,823.81006 77 Billion                                 3.0944 Monthly
2/1/18         2,816.44995              2,835.95996               2,532.68994           2,713.83008 80 Billion                                 6.8686 Monthly
3/1/18         2,715.21997              2,801.89990               2,585.88989           2,640.87012 76 Billion                                 9.3724 Monthly
4/1/18         2,633.44995              2,717.48999               2,553.80005           2,648.05005 70 Billion                                 9.1260 Monthly
5/1/18         2,642.95996              2,742.23999               2,594.62012           2,705.27002 76 Billion                                 7.1624 Monthly
6/1/18         2,718.69995              2,791.46997               2,691.98999           2,718.37012 77 Billion                                 6.7128 Monthly
7/1/18         2,704.94995              2,848.03003               2,698.94995           2,816.29004 65 Billion                                 3.3525 Monthly
8/1/18         2,821.16992              2,916.50000               2,796.34009           2,901.52002 69 Billion                                 0.4276 Monthly
9/1/18         2,896.95996              2,940.90991               2,864.12012           2,913.97998 62 Billion                                         -     Monthly
10/1/18         2,926.29004              2,939.86011               2,603.54004           2,711.73999 91 Billion                                 6.9403 Monthly
11/1/18         2,717.58008              2,815.14990               2,631.09009           2,760.16992 80 Billion                                 5.2783 Monthly
12/1/18         2,790.50000              2,800.17993               2,621.53003           2,695.94995 14 Billion                                 7.4822 Monthly
        
12/3/18         2,790.50000              2,800.18000               2,773.38000           2,790.370004 Billion                                 4.2420 Daily
12/4/18         2,782.43000              2,785.93000               2,697.18000           2,700.060004 Billion                                 7.3412 Daily
12/6/18         2,663.51000              2,696.15000               2,621.53000           2,695.950005 Billion                                 7.4822 Daily


Box chart representation


11 sectors of the stock market

Death cross and Golden cross

In Technical Analysis, a Death cross happens when the short term moving average crosses long term moving average and goes below it. This is seen as the start of a bearish market (but is not always the case based on historical trends)

A Golden cross happens when short term moving average crosses long term moving average and goes above it. This is seen as the beginning of bullish market.

See the S&P 500 index over years as an example. The short term is 50 day moving average and long term is 200 day moving average. Source: finance.yahoo.com


An hourly trend during 12/6-12/7/2018 shows formation of the crosses. Source: finance.yahoo.com


Read this marketwatch.com article on 12/7: https://www.marketwatch.com/story/heres-what-the-dow-coming-close-to-a-death-cross-really-means-for-stocks-2018-12-06

December 6, 2018

Long vs Short trade

Simple defintions:

Long Trade or Buy means the investor is buying stocks with the expectation that the value will go up in future.


Short Trade or Sell means the investor is borrowing stocks from a Broker and selling it to another investor with the expectation of value going down. Once the stocks value decrease, the investor buys back from market and return to Broker.

S&P 500 index with 50 and 200 day moving average on Dec 6, 2018

Source: finance.yahoo.com


Goldilocks economy

Found a good definition at https://www.thebalance.com/goldilocks-economy-definition-causes-effects-3305932:

>>
A Goldilocks economy is when growth isn't too hot, causing inflation, nor too cold, creating a recession. It has an ideal growth rate of between 2-3 percent, as measured by GDP growth. It also has moderately rising prices, as measured by the core inflation rate. The Federal Reserve has set this target inflation rate at two percent.

This healthy economy is named after the famous children's story, Goldilocks and the Three Bears. The little girl only ate the bear's porridge that was neither too hot nor too cold. Like the porridge, the Goldilocks economy is one that is "just right."
<<

December 4, 2018

Treasury Yield Curve Inversion

Stock markets plunged on December 4th, 2018 on the fears that the gap between long-term and short-term treasury yields is narrowing.

In general the 10-year yield should be much above 2-year. The narrowing shows that investors are loosing confidence in the current economic conditions and parking money in long-term bonds. With more investment in long-term bonds, the supply-demand ratio changes pushing down the yield lower.


An inversion of the gap/spread is an indicator of recession. This was reason for the market crash. Ref: https://www.forextraders.com/forex-news/are-you-aware-of-our-most-accurate-leading-indicator-of-economic-peril/


In addition there are other indicators that long-term yields are going lower that short-term. See the spread between 3yr to 5yr yields on 12/3 as compared to 11/20.


November 28, 2018

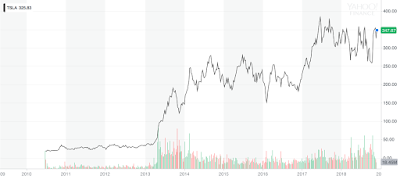
Tesla (TLSA) over years


Source: finance.yahoo.com


Microsoft (MSFT) over years

Source: finance.yahoo.com

Google (GOOG) over years

Source: finance.yahoo.com

Netflix (NLFX) over years


Apple (APPL) over years


Amazon (AMZN) over years


Source: finance.yahoo.com

Facebook (FB) over years


Source: finance.yahoo.com

Nasdaq vs FAANG growth

1990s to present. Source: finance.yahoo.com


S&P, Dow Jones and Nasdaq over years

Click to zoom. Created using finance.yahoo.com

GSPC - S&P
DJI - Dow Jones
IXIC - Nasdaq

Before 1980s


1980s to 2000s


2000s onwards


End


Java program to print Fibonacci sequence

import java.text.DecimalFormat;
  
public class Fib {

        public static void main(String args[]) {
                for (int i = 1; i <= 20; i++) {
                        System.out.println("[" + i + "] : " + fib(i) + " : " + new DecimalFormat("#.###").format(ratio(i)));
                }
        }

        private static int fib(int n) {
                if (n==1 || n==2) {
                        return 1;
                } else {
                        return fib(n-1) + fib(n-2);
                }
        }

        private static double ratio(int n) {
                if (n > 1) {
                        return (double)fib(n-1)/(double)fib(n);
                } else {
                        return 0;
                }
        }

}